Demonstration of Governance, Political, and Economic Functional Impact Using the Regional Arts Commission

Introduction

Publicly supported organizations exist at the intersection of governance, politics, and economics. Whether created by voter mandate or sustained through dedicated public funding, boards and commissions play a critical role in delivering quasi-governmental services that respond to community needs while maintaining political legitimacy and economic justification. Their effectiveness is measured not only by operational performance, but by their ability to demonstrate value—both tangible and intangible—to the regions they serve.

At the local and regional level, economic considerations shape nearly every policy and governance decision. Yet the underlying question is rarely limited to balance sheets alone. Instead, public investment invites a broader evaluation: Does this investment produce meaningful economic benefit, improve quality of life, and sustain public support? In this sense, economic impact becomes inseparable from political impact. Public organizations must continuously justify who benefits, how benefits are distributed, and why continued investment is warranted.

This analysis is structured around three interrelated functions that define the durability of public and quasi-public institutions:

  1. Governance, which ensures professional operations, accountability, and alignment with public purpose;
  2. Political function, which reflects constituency support, coalition strength, and legitimacy in public decision-making, which then meet the definition of who gets what and why; and
  3. Economic impact, which articulates how public investment circulates through and strengthens the regional economy.

Using these three functions as an analytical framework, this blog compares two economic impact studies produced by the Regional Arts Commission (RAC). Specifically, it examines the 2012 (Report IV) and 2025 (Report VI) studies—documents released during markedly different economic and political contexts. The 2012 report reflects conditions during the Great Recession, while the 2025 report emerges in a post-COVID recovery environment amid uncertainty surrounding federal arts funding.

By placing these two studies side by side, this comparison explores how RAC has used economic impact analysis as a strategic tool to communicate value, maintain political support, and reinforce its governance role within the St. Louis region. More broadly, it demonstrates how economic impact studies function not merely as technical reports, but as instruments that sustain public trust and institutional legitimacy across shifting economic and political landscapes.

Comparison of Regional Arts Commission of

St. Louis Economic Impact Studies

2012 and 2025

1. Overall Economic Impact: Strong Growth

Measure2012 Study (FY2010)2025 Study (FY2022)Change
Total Economic Activity$582.3M$868.7M▲ +$286.4M (~+49%)
GeographySt. Louis City & CountyGreater St. Louis AreaExpanded regional scope
ContextDuring Great RecessionPost‑COVID recoveryDifferent economic climates

Conclusion:
The arts and culture sector’s total economic footprint grew substantially between the two studies, even after adjusting for the fact that the later study occurs during pandemic recovery rather than economic expansion.


2. Employment Impact: Net Growth, but Slower Momentum

Measure20122025Change
Total Jobs Supported18,98311,986▼ Decline
Arts‑Organization Jobs10,046 (FTE)8,169 (headcount)▼ Decline

Important context:

  • The 2012 study used Full‑Time Equivalent (FTE) jobs
  • The 2025 study uses total job headcount (full‑time, part‑time, seasonal)

Conclusion:
While employment impact appears lower in 2025, this reflects:

  • lingering pandemic job losses, and
  • methodological differences between studies.

The 2025 report explicitly notes that recovery is ongoing and job levels have not fully rebounded.


3. Household Income: Significant Growth

Measure20122025Change
Household Income Generated$452.3M$611.3M▲ +$159.0M (~+35%)

Conclusion:
Despite fewer reported jobs, total household income rose sharply, indicating:

  • higher wages,
  • greater spending per job,
  • and stronger economic multipliers per dollar spent.

4. Government Revenue: Major Expansion

Measure20122025Change
Local Government Revenue$28.3MIncluded in $155.2M total
State Government Revenue$29.6MIncluded in $155.2M total
Total Tax Revenue~$57.9M (local + state)$155.2M (local + state + federal)▲ Nearly 3×

Conclusion:
The arts sector’s public‑sector fiscal return increased dramatically, strengthening the argument that arts funding produces measurable tax benefits at all government levels.


5. Audience Spending & Tourism: Mixed but Resilient

Measure20122025Change
Total Attendance11.3M8.2M▼ Decline
Audience Spending (Total)$269.1M$289.4M▲ +$20.3M
Avg. Spend per Attendee~$23.76$35.74▲ Significant increase
Non‑Local Attendees26.8%19.5%▼ Decline

Interpretation:

  • Fewer attendees, but
  • much higher spending per person, especially among visitors

Conclusion:
Tourism volume declined post‑pandemic, but economic efficiency per attendee increased, meaning each visitor now contributes more to the local economy than in 2012.


6. Community & Social Impact: New Growth Area (2025 Only)

The 2012 study focused almost exclusively on economic metrics.
The 2025 study adds measured social impact:

Indicator (2025)Result
Community pride inspired89.0%
Would feel loss if venue closed84.9%
Venue seen as community pillar80.6%
Importance for future generations85.9%

Conclusion:
This represents a major expansion of impact measurement, showing that arts and culture contribute not just economically but also to community cohesion, identity, and well‑being—an area not quantified in 2012.


7. Equity & Inclusion: New Findings in 2025

  • No equity‑specific analysis in 2012
  • 2025 study finds:
    • Attendees at BIPOC/ALAANA‑serving organizations spend more per person than average
    • Social impact levels are equal or higher than regional norms

Conclusion:
The 2025 study demonstrates that equitable investment does not reduce economic impact and may enhance it—an insight entirely absent from the earlier study.


8. Summary of Growth vs. Decline

Areas of Clear Growth

  • ✅ Total economic activity
  • ✅ Household income generated
  • ✅ Tax revenue generated
  • ✅ Audience spending per person
  • ✅ Measurement of social and equity impacts

Areas of Decline or Constraint

  • ⚠️ Total attendance
  • ⚠️ Share of non‑local visitors
  • ⚠️ Job counts (pandemic‑affected and methodologically different)

Bottom‑Line Comparative Conclusion

2012 conclusion:

The arts are an economic anchor that proved resilient during recession. The nonprofit arts and culture sector in St. Louis delivers measurable returns in employment, income, tourism, and public revenue, while enhancing quality of life and regional competitiveness.

2025 conclusion:

The arts are economic infrastructure and social capital, delivering higher total impact, stronger fiscal returns, and measurable community benefits—even while still recovering from a historic shock.

Overall takeaway:
Between 2012 and 2025, the arts in Greater St. Louis became more economically powerful per dollar and per attendee, more clearly tied to public revenue, and newly recognized for their social and equity impacts, despite pandemic‑related declines in attendance and employment.

Differences of Study Methodologies

1. Scope of What Is Measured

2012 Study (Arts & Economic Prosperity IV)

  • Focused almost entirely on economic impact
  • Core measures:
    • Total economic activity
    • Jobs (reported as Full‑Time Equivalent jobs)
    • Household income
    • Local and state government revenue
    • Audience spending and tourism
  • No formal measurement of social or community impact

2025 Study (Arts & Economic Prosperity 6)

  • Measures both economic and social impact
  • Adds new dimensions:
    • Community pride
    • Sense of loss if venues disappear
    • Arts as community “pillars”
    • Intergenerational value
    • Equity and inclusion outcomes

Methodological shift:
The 2025 study intentionally expands beyond “dollars and jobs” to capture how arts and culture affect community well‑being, making it a broader, multidimensional impact study rather than a purely economic one.


2. Definition of Jobs

2012

  • Jobs reported as Full‑Time Equivalent (FTE)
    • Combines part‑time and full‑time labor into a single standardized unit
  • Emphasizes labor volume

2025

  • Jobs reported as total headcount
    • Includes full‑time, part‑time, and seasonal jobs
  • Reflects people employed, not labor hours

Why this matters:
A decline in job numbers between studies does not necessarily mean fewer people working fewer hours—it reflects a different counting method, compounded by pandemic‑era labor disruption.


3. Geographic Definition

2012

  • Geography: St. Louis City and County
  • More narrowly defined region

2025

  • Geography: Greater St. Louis Area
  • Explicitly defined and consistently applied across AEP6 regions

Methodological implication:
The later study uses a broader and more standardized regional definition, improving comparability across regions but complicating direct historical comparisons.


4. Audience Spending Measurement

2012

  • Audience spending measured
  • Lower average spending per attendee
  • Smaller audience survey sample
  • Fewer methodological controls described

2025

  • Audience spending remains a core differentiator but:
    • Larger survey sample
    • Clear exclusion of on‑site spending to avoid double counting
    • More detailed breakdown of local vs. non‑local spending
    • Explicit travel‑purpose questions

Methodological improvement:
The 2025 study uses more refined audience‑intercept techniques, improving precision and reliability of tourism and spending estimates.


5. Treatment of Equity and Representation

2012

  • No explicit equity framework
  • Participation skewed toward larger, more established organizations
  • No demographic or community‑of‑color analysis

2025

  • Equity is methodologically embedded
  • Includes:
    • Intentional sampling of BIPOC/ALAANA‑serving organizations
    • Multilingual surveys
    • Equity‑focused participation targets
    • Explicit caution against harmful comparisons

Methodological shift:
The 2025 study corrects for systemic underrepresentation in earlier studies, changing who is counted and whose impact is visible—this can affect totals and averages in meaningful ways.


6. Treatment of External Shocks (Recession vs. Pandemic)

2012

  • Conducted after the Great Recession
  • Results framed as resilience during economic downturn
  • Study‑to‑study comparisons implied as valid

2025

  • Conducted after COVID‑19
  • Explicitly warns:
    • Study‑to‑study comparisons are not recommended
    • Pandemic caused structural disruption in attendance, staffing, and operations

Methodological stance change:
The 2025 study is more conservative and transparent about limitations in longitudinal comparison, whereas the 2012 study was more comfortable with trend comparison.


7. Underlying Economic Modeling

2012

  • Used customized input‑output analysis
  • Earlier generation of economic modeling tools

2025

  • Uses IMPLAN platform
  • More granular industry modeling
  • Region‑specific economic “fingerprints”
  • Higher computational rigor

Result:
The 2025 estimates are methodologically more precise, but not directly interchangeable with earlier model outputs.


Bottom‑Line Methodological Difference (Plain Language)

2012 study:

“How much money and how many jobs do the arts generate?”

2025 study:

“How do arts and culture function as an economic industry and as social infrastructure—and who benefits?”

Because of:

  • different job definitions,
  • expanded geography,
  • new equity sampling,
  • social‑impact measures,
  • and post‑pandemic disruption

Summary

This blog compares two major economic impact studies conducted for the Regional Arts Commission (RAC)—the 2012 Arts & Economic Prosperity IV study and the 2025 Arts & Economic Prosperity 6 study—using a framework that integrates governance, political function, and economic impact. Examined side by side, the studies reveal how both the scale and the meaning of “impact” have evolved across two very different economic eras: the Great Recession and the post‑COVID recovery.

Across nearly all economic indicators, the arts and culture sector in Greater St. Louis demonstrates substantial growth. Total economic activity, household income, audience spending, and public tax revenue all increased markedly between the two studies. Even where declines appear—most notably in attendance and job counts—those shifts are shaped by pandemic disruption and important methodological differences, rather than by structural weakness in the sector. In fact, higher spending per attendee and stronger fiscal returns suggest that the sector has become more economically efficient over time.

The 2025 study also marks a significant shift in what is measured and valued. Unlike the 2012 study, which focused almost exclusively on dollars, jobs, and tax revenue, the later report incorporates social, community, and equity dimensions. Measures of community pride, perceived loss, intergenerational value, and equity outcomes position the arts not only as an economic engine, but as social infrastructure that supports cohesion, identity, and public wellbeing.

Taken together, the two studies show that economic impact analysis is not static. It reflects changing economic conditions, improved methodology, and evolving public expectations about accountability, inclusion, and value. For RAC, these studies function as more than technical reports—they are tools for governance, political legitimacy, and sustained public investment.

Much of what is written in the impact studies is to signal to constituents that all is well and resilient in tough times.  RAC is funded through the St. Louis City and County hotel tax.  Both studies include at least the amount arts visitors spend in this area.  But, as the total number of visitors declined in 2025, RAC added categories in audience spending related to retail shopping, clothing and accessories, and miscellaneous.  Many hotels have a gift shop.

They’re addressing both a political and an economic function through this data.  The inclusion of equity and diversity of audience with their economic impact is similarly addressing a response to political and governance issues. 


Conclusion

The comparison of RAC’s 2012 and 2025 economic impact studies illustrates how arts and culture have moved from being framed primarily as an economic asset to being understood as both economic infrastructure and civic capital. Over time, the sector has grown more productive per dollar invested, more transparent in how impact is measured, and more intentional about whose contributions and benefits are recognized. This is typical of responses to governance and political interests weighing in on the operations of an organization reliant on public funding.

Equally important, the evolution of these studies reflects a broader shift in public governance. In an environment of fiscal scrutiny, political polarization, and uncertainty around public funding, impact analysis serves as a bridge between numbers and public purpose. The 2012 study helped affirm the arts’ resilience during recession; the 2025 study extends that narrative by demonstrating recovery, adaptability, and social relevance after an unprecedented disruption.

Ultimately, this comparison underscores that the value of the arts cannot be reduced to attendance counts or job totals alone. Their true impact lies in how they circulate resources through the regional economy, return revenue to public systems, strengthen community identity, and contribute to a more inclusive civic landscape. For policymakers, funders, and the public, the lesson is clear: sustained investment in arts and culture is not merely a discretionary expense—it is a strategic investment in economic vitality, democratic legitimacy, and the long-term wellbeing of the St. Louis region.

(Author’s note: Much of the data presented is based on audience self assessed surveys. The sample of 1,973 audience members includes 401 members identified in the BIPOC/ALAANA communities in the 2025 survey)

Governance and Political Considerations

List of appointees to the Regional Arts Commission appointees with title, who they represent and expiration of their term.

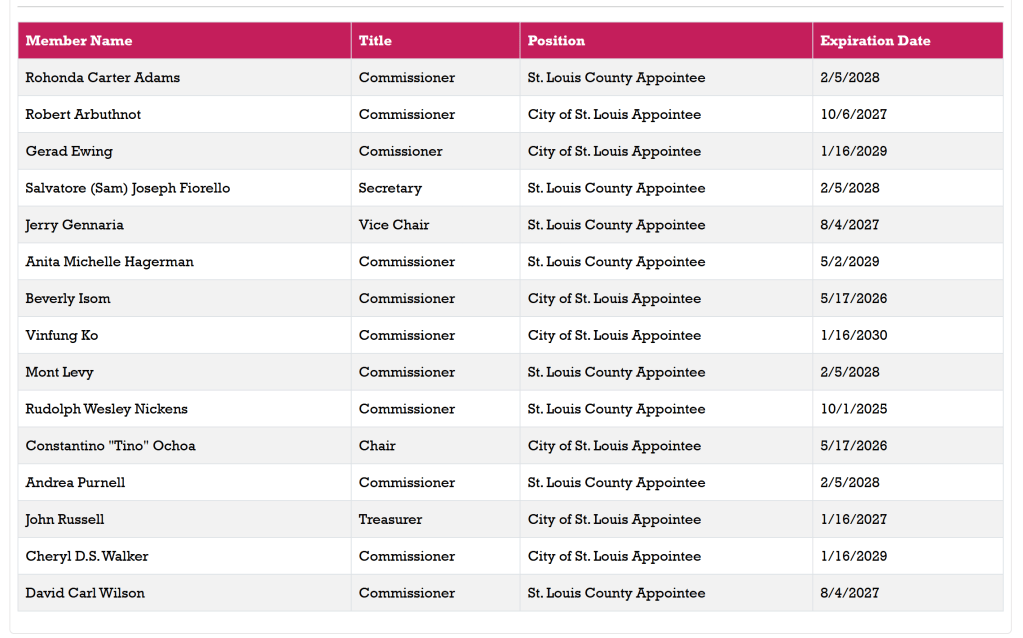
Above is a list of current appointees to the Regional Arts Commission appointees with title, who they represent and expiration of their term from the county boards and commissions page. St. Louis City has similar information on their website with regards to operations and duties.

Organizational Structure Summary: Political, Economic, and Governance Considerations for the Regional Arts Commission

The Regional Arts Commission (RAC), legally established under state law as the Regional Cultural and Performing Arts Development District, operates within a multi-jurisdictional governance structure that reflects both political representation and economic purpose. Its structure, authority, and functions are shaped by statutory mandates, public appointments, and its role in regional cultural development.

Governance Structure
The Commission is composed of fifteen members, with eight appointees representing St. Louis County and seven representing the City of St. Louis. All members are appointed by the chief executive of their respective jurisdictions. This structure embeds the organization within a formal layer of public governance, linking its operations directly to elected leadership and state-authorized oversight. Because the Commission exists by statute, its activities and performance are subject to scrutiny not only at the local level but also by state legislators, creating an environment where organizational challenges can quickly escalate into public or political concerns.

Political Considerations
The RAC’s mandate to unify cultural and performing arts organizations across the region carries inherent political dimensions. By organizing and supporting a broad arts constituency, the Commission functions as a coalition-builder that aligns cultural stakeholders with public officials and major funding interests. This alignment can strengthen regional advocacy for the arts but also exposes the organization to political pressures. Any operational failures or controversies risk becoming politicized, particularly given the ability of legislators and other officials to intervene or amplify concerns.

Economic Considerations
Economically, the Commission plays a central role in stewarding public funding mechanisms, including revenues derived from hotel and motel taxes. Its mission links cultural development with regional economic impact, positioning the arts as both a public good and an economic driver. Political instability or governance challenges can therefore have direct economic consequences, potentially undermining funder confidence, discouraging participation, or threatening the sustainability of supported organizations.

Interdependence and Organizational Stability
Political, economic, and governance functions within the RAC are closely interdependent. Disruption in one area can destabilize the others, increasing organizational risk. In such circumstances, leadership intervention is often required to restore stability. These interventions frequently involve change agents who may pursue adjustments in operations, policy, or personnel to address underlying dysfunction and reestablish organizational credibility.

Unlocking Fiscal Benefits: St. Louis County and City Collaboration

Ever since the Great Divorce St. Louis City and County have been looking for ways to get back together, in one way or another. As government and the economy has gotten more complex it has become a reality that they need each other. Conversations around cost sharing began to happen and eventually the Missouri Council for a Better Economy solicited a study for City-County collaboration focused on cost sharing.

Essentially, they were looking to find opportunities for economies of scale between the entities. Collaboration without a vote of the people. The following is a summary of key pieces of the executive summary of that report with a downloadable policy brief. St. Louis County enjoys a fairly high rate of purchasing power, in part because it has minimalities within to partner with to help drive down costs. Budgetary constraints or storage capacity in the city often prevent the single entity from flexing the same muscle.

A former chief executive relayed this example years ago. He said road salt is a good example, and this is somewhat hypothetical at this time as it may be the city and county are collaborating more closely when it comes to salt. Municipalities and county transportation use salt on roads and the county has storage capacity to purchase for the estimated need of the whole winter season. This drives down costs significantly. St. Louis City, on the other hand, may have to buy a barge at a time, over time, to spread out the costs because they are at capacity.

St. Louis County government maintains what is referred to the matrix. It’s a spreadsheet of every agreement it has with municipalities to provide services such as inspections, plan review, and police support. This improves capacity for St. Louis County, creates efficiency of service and provides for better purchasing power. They do this in a number of areas. On the other hand, St. Louis City is often left to their own devices, which leads to higher costs with a constrained tax base. It should be pointed out that St. Louis City has been growing that tax base significantly in the last decade. But the economic constraints remain and collaboration would go a long way in burden sharing in the region.

City of St. Louis and St. Louis County Intergovernmental Collaboration StudyThe PFM Group

Key Context and Issues –

1. Structural Fragmentation

  • Missouri has an unusually high number of local governments, including counties, municipalities, special districts, and school districts.
  • The City–County separation (1876) created rigid boundaries with limited flexibility for addressing shared regional challenges.
  • Multiple constitutional amendments (1924, 1945, 1966) created legal pathways for cooperation or consolidation, but all consolidation efforts have failed due to insufficient support.

2. Fiscal Pressure as a Catalyst

  • The 2008–2009 national recession significantly reduced revenues for both City and County governments.
  • Budget stress increased the urgency to pursue shared services as an alternative to structural consolidation.

3. Existing Regional Cooperation

  • The report emphasizes that cooperation is not theoretical—numerous regional efforts already exist, including transportation, cultural institutions, and large facilities.
  • Beyond high‑profile examples, the report notes “scores” of less visible shared activities already underway.

Shared Services Framework

The study categorizes collaboration opportunities into four primary mechanisms:

  1. Economies of Scale – Combining operations to reduce per‑unit costs
  2. Combined Purchasing Power – Joint procurement to lower prices
  3. Co‑location – Shared facilities or administrative functions
  4. Excess Capacity Utilization – One government providing services for the other where capacity exists

Initiatives are further organized by:

  • Implementation timeframe (short‑term vs. long‑term)
  • Service delivery area

Major Service Areas and Key Findings

Administration

  • Opportunities for shared training, cooperative purchasing, and consolidation of administrative functions.
  • Significant savings potential from combined purchasing, particularly utilities, bulk commodities, and employee benefits.
  • Printing operations identified as an area where economies of scale are likely.

Health

  • Strong case for regional coordination, given that public health risks cross jurisdictional boundaries.
  • The report explicitly states that service quality and health outcomes may improve, but direct cost savings are unlikely to be substantial.
  • Non‑quantifiable benefits (“positive externalities”) are emphasized.

Parks and Recreation

  • Limited overlap between City and County systems.
  • Opportunities exist for joint volunteer programs and mutual aid agreements, but savings potential is modest.

Finance

  • Identified as a high‑potential area for shared systems.
  • Shared property tax assessment and collection systems could:
    • Produce economies of scale
    • Improve overall tax collections

Economic Development

  • The report notes a national shift away from jurisdictional competition toward cooperation.
  • Greater coordination, especially around federal grants, is expected to benefit both governments.

Human Services

  • Populations served (e.g., homeless services, workforce development, aging services) are well‑suited to regional or co‑located delivery models.
  • Other regions have achieved cost reductions and/or service improvements through such approaches.

Public Safety

  • The County’s electronic monitoring program is highlighted as a model the City could leverage to reduce incarceration costs for non‑violent offenders.
  • Additional cooperation is suggested, though police services are largely excluded due to state governance structures.

Public Works

  • Opportunities include:
    • Joint fuel purchasing
    • Fleet standardization
    • Standardized code enforcement to reduce costs for both governments and residents

Cost Savings Analysis (As Stated in the Report)

  • The report repeatedly emphasizes that precise savings estimates are difficult due to:
    • Political feasibility
    • Implementation complexity
    • Resource availability
    • External economic factors
  • Not all initiatives have quantifiable fiscal impacts.
  • Despite these limitations, PFM concludes that:

If key initiatives are successfully implemented, combined annual savings could range from $10 million to $40 million in 2011. Savings may be increased today when adjusted for inflation. Some recommendations have been initiated or concluded, such as in economic development. It has been about 15 years since the Economic Development Partnership has been created. It might be worth reviewing whether the expected cost savings were realized

Conclusion on Cost Savings

Based strictly on the document’s findings:

  • Meaningful cost savings are achievable, but they are unevenly distributed across service areas.
  • The largest and most reliable savings are likely to come from:
    • Administrative consolidation
    • Cooperative purchasing
    • Shared financial systems
    • Public works standardization
  • Health and human services offer strong service and outcome benefits, but limited direct fiscal savings, according to the report.
  • The projected $10–$40 million annual savings range should be understood as:
    • Dependent on sustained political support
    • Incremental rather than immediate
    • Strongly tied to execution quality rather than policy intent alone

Overall conclusion:
The study positions intergovernmental collaboration not as a one‑time budget fix, but as a long‑term cost‑containment and service‑improvement strategy. Financial savings are real and potentially substantial, but the report makes clear that governance commitment and implementation discipline are the decisive factors in realizing them.

Initiatives vs. Savings Certainty

Reentering St. Louis County: Legal and Political Insights

Introduction

Recently, County Executive Dr. Sam Page stated he thought the City should enter the county as a new municipality. There are currently 88 cities, towns, villages, and unincorporated areas throughout St. Louis County. I’ll discuss the difference of these in a future blog, but bringing St. Louis City, a charter city. A charter city is a municipality that operates under its own “home-rule” charter rather than general state laws. This is interesting considering the state recently took over St. Louis City’s police department, again. In theory home rule allows local residents to define their own form of government, powers, and administrative procedures, provided they comply with the Missouri Constitution. There are 42 charter cities in Missouri.

Terry Jones, author of Fragmented by Design – Why St. Louis Has So Many Governments, wrote a policy brief for the Public Policy Research Center in 2011 discussing the implications and feasibility of one variation of St. Louis City-County reunification, reentry of the city into the county. the PPRC is now a part of the Community Innovation and Action Center at the University of Missouri- St. Louis. Below I summarized the the policy brief and then discuss some of the key thoughts and findings. Keep in mind, this policy brief was published before Better Together attempted to reunify the city and county, which ended disastrously for many reasons. I’ll get into that later. But I bring it up because there may have been legislation between 2001 and now, intended to help Better Together, that changes some of these findings. As we review studies we’ll uncover a lot of ways the city and county differ in governance and some of those issues have to be addressed before reentry can happen.

The conclusion of the brief is that reentry is feasible, but not without it’s own issues. This will also take time to form the vehicle for reentry, create a plan, and inform the people, and have them vote on it. All along the way, studies will be drafted and polling will occur in order for regional leadership to thread the needle of democracy.

Summary of Reconciling the Great Divorce: The City of St. Louis Reentering St. Louis County

Overview

The policy brief examines the legal, administrative, and political implications of the City of St. Louis reentering St. Louis County as its 92nd municipality. Drawing on Missouri constitutional provisions and historical precedent, the author argues that while reentry is legally feasible and often viewed as the most practical reunification option, it presents complex structural challenges that require careful resolution (Jones, 2011).


Key Findings

  1. Reentry Is Constitutionally Permissible and Politically Feasible
    • Missouri’s Constitution explicitly allows the City of St. Louis to reenter St. Louis County.
    • Among several consolidation options, reentry is widely viewed as the least disruptive to existing City and County autonomy and thus the most politically viable (Jones, 2011).
  2. The Process Is Voter-Driven and Highly Structured
    • Reentry would require voter-initiated petitions in both the City and the County.
    • A Board of Electors would be appointed to develop a plan, which must then be approved by concurrent majorities of City and County voters.
    • The board’s authority is broad and cannot be restricted solely to reentry, increasing uncertainty in outcomes (Jones, 2011).
  3. County Functions Would Likely Shift to St. Louis County
    • If reentry occurs, the County would probably assume most or all “county functions” currently performed by the City, fundamentally altering City governance responsibilities (Jones, 2011).

Major Problems and Challenges

  1. Integration of Non-Judicial County Functions
    • The City and County organize functions such as tax collection, revenue administration, and record keeping differently.
    • Transferring City offices into County departments raises unresolved questions about organizational structure, efficiency, and employee placement.
  2. Judicial System Consolidation
    • Reentry would eliminate the City’s status as an independent judicial county.
    • This would require merging court systems, prosecutorial offices, jail facilities, and jury pools—posing logistical, legal, and political challenges.
  3. Employment and Labor Protections
    • Missouri’s Constitution protects the employment rights of displaced City workers.
    • It remains unclear whether affected employees would transfer to County employment or remain on the City payroll, creating potential financial and legal conflicts.
  4. County-Like Functions Performed by the City
    • The City independently manages functions typically handled at the county level, such as:
      • Economic development
      • Property assessment
      • Public health
    • Post-reentry, policymakers must decide whether these functions should be merged into County systems or remain uniquely City-operated.
  5. County Council Representation and Redistricting
    • Reentry would require redrawing County Council districts.
    • Decisions about the number of districts and how City voters are distributed raise concerns about political representation and equity.
  6. Special District Governance
    • Joint City–County entities (e.g., Metropolitan Sewer District, Zoo-Museum District) are built on shared governance.
    • Reentry could destabilize these arrangements as other municipalities question the City’s continued influence.

Conclusion

Terry Jones concludes that while City–County reentry is legally possible and superficially attractive, it would trigger far-reaching institutional changes. The process would be lengthy, politically demanding, and likely dominate regional civic debate for years. Any reentry plan must address not only governance efficiency but also representation, labor rights, and regional equity.


Jones, E. T. (2011). Reconciling the great divorce: The City of St. Louis reentering St. Louis County (Policy Brief No. 25). Public Policy Research Center, University of Missouri–St. Louis.

Adding Context and Reviewing the Policy Brief

One of the key findings of Fragmented by Design (2000) is that if the municipal or major regional governments don’t want to take blame or responsibility for the needs of the people then they create a special government entity to manage the issue. In doing this, we have gotten Metropolitan Sewer District, Great Rivers Greenway, and the St. Louis Economic Development Partnership, which is actually an umbrella organization of state authorized programs or political subdivisions. There are good reasons for these to be external. But their structure is regionally focused at least between the city and county, and GRG includes surrounding counties as well.

However, we have found our structure of governance is also duplicative in services, varying in capabilities among regional populations leading to inequities, and funded through varying tax structures. The policy brief lays out political implications of changes, such as the ability of the City to retain powers, like appointments to these regional governance organizations I mentioned. Regional boards and commissions get appointed by the county executive and mayor through a mix of city and county and sometimes state governor appointments. Recently, the St. Louis County Council has tried to require more input through the approval process of some of these appointments, adding a layer of politics that can be a wedge at times.

The key takeaways of this brief, I think, are in the transfer of powers questions. Will the city want to turn over its county responsibilities now, like collector of revenue and judicial and prosecutorial responsibilities to the county? Dr. Page may have provided a baked in solution when he called for reentry. He also called for the county to move offices into the city.

Proposals for the county to reestablish a physical presence in the city also intersect with broader economic conditions. According to Cushman & Wakefield, at the end of 2025 St. Louis City recorded an 18.5% office vacancy rate, with the Central Business District reaching 26.0%. Strategic relocation of county functions could therefore serve both governance and economic revitalization goals. That is considered high and has a significant impact on local restaurants and can lead to a compounding of economic problems and crime. Over the last ten years, the commercial vacancy rate has been 16-20%.

Simultaneously, the county has to vacate its administration building by December 2027 because it is not up to code in the City of Clayton. It is unlikely city reentry would happen by then. But given the average vacancy rate of the city this solution appears possible and would only strengthen the City’s economy. Keep in mind, City reentry would cause some county functions managed by the city to be transferred to St. Louis County already.

Currently, the St. Louis County Charter requires the county seat to be in the City of Clayton. All this really means is that the county council must meet there. Offices have already operated around the county. But in the last 15-20 years there has been significant decentralization of services from Clayton to surrounding areas. For instance, the St. Louis County Department of Transportation and Public Works moved its offices out to N. Lindbergh Blvd from Clayton over a decade ago. In 2012, the Department of Health built a new headquarters on N. Hanley Road.

Decentralization has been happening for some time and has not appeared to disrupt services or management coordination. So, moving some operations into the City makes functional sense, while solving certain city occupancy issues, should they continue. The question is, which offices or departments and where in the city? One may presume the Central Business District, but that may put a burden on regional stakeholders who established offices near Clayton. Clayton is already on the east side of the county. Moving it further from businesses on the western edge may be met with resistance. Again, this goes to the question of what gets moved and where.

Conclusion: Aligning Authority, Accountability, and Place

The governance challenges facing the St. Louis region are not simply the result of inefficiency or institutional inertia. They are the cumulative outcome of deliberate decisions to separate authority from accountability through a proliferation of special districts and regional entities. While many of these structures were created for sound functional reasons, their collective effect has been a fragmented system that duplicates services, varies widely in capacity across communities, and obscures responsibility for outcomes.

As the policy brief makes clear, the most consequential questions now facing the region are not about consolidation for its own sake, but about the transfer and alignment of powers. Decisions about whether the city should relinquish certain county‑level responsibilities, how appointments to regional boards are structured, and where governmental functions are physically located all reflect deeper choices about who governs, who benefits, and who bears the political risk of reform.

Proposals for county reentry into the city, including the relocation of offices and operations, illustrate this tension clearly. Such moves are not merely symbolic or logistical. They carry real implications for economic activity, accessibility, and the balance of power between city and county stakeholders. At the same time, they offer an opportunity to rethink how governance structures can better support both regional efficiency and urban revitalization, particularly in the context of persistent office vacancy and decentralization trends.

Ultimately, any meaningful reform of regional governance in St. Louis will require confronting the tradeoffs that fragmentation has long deferred. Aligning authority with accountability—and doing so in a way that promotes equity across the region—demands more than technical fixes. It requires political clarity about the purpose of regional institutions, transparency in how power is exercised, and a willingness to reconsider long‑standing assumptions about where government belongs and whom it serves.

Club Building Basics

Every couple of years, the local leadership of the Democratic Party decide they need to build their clubs. It’s a funny process of people getting together, complaining about who’s not doing what and who is and then arguing over the strategy of building the club.

As I wrote before, political parties don’t serve the same function they did in the past. The local apparatus should be no different, except they are a whole other beast.

There are inherently two types of clubs: active and inactive. We have inactive clubs for many reasons, and there’s little reason to get into it. Building a club takes work and starts with understanding your purpose and knowing your audience.

To know your audience, you’ll need to figure out the political leanings of your district. Turnout varies from year to year and by the office. To get the best picture leaders need to look at all races within their club’s boundaries and understand the variance of turnout between them.

Races for governor, US Senate, and other statewide offices will cover all of the club’s district. But state legislative offices often share these districts and cross parts of multiple wards, townships, parishes and other types of political subdivisions. You may have to piece together the puzzle to understand your district.

By understanding turnout for the different offices you will hopefully learn patterns and get an idea for how your audience is spread out across the geographic area. If you have access to a party database, you will be able to manage all of this from the dashboard for easy access.

Voter Database Basics

Who votes is a public record, accessible to any person or organization for political purposes. A lot of people don’t realize that anyone can go to the local board of elections and request a copy of that record. Political parties regularly collect this information and have developed technology to add other information in what is called a voter file.

The voter record starts with the name and address of the voter and then you can request which elections they voted. Lists are purchased adding phone numbers. They also collect information about gender, race, religion and other relevant demographic information. This information is the bulk of the voter database.

The information you add to the file will be the most crucial part of the database.

From the party database, you may have access to party scores and a preference for your party. The party preference is usually the easiest way to identify your audience. By calling and talking to voters, we collect their feedback. The more contacts there are, we create a better picture of the voter. Simultaneously, the higher office that collects the information, the greater weight is given to that data.

The preference will use five identifiers of strong, leaning and independent voters for party preference. However, if they are a new voter, you will likely see unidentified for the preference of some voters. That will change after a couple of contacts. Keep in mind that campaigns are using the database simultaneously and changing information all the time.

The dashboard at the data director level is the controlling mechanism for permission to the functionality of the database for all other users. The fact is that candidates and committeepeople usually don’t know the full spectrum of permissions and therefore don’t know what permissions to request.

At the same time, we have to recognize some people can’t use a computer. Technology and politics are very similar. Neither is a place for amateurs, and you can only move past being an amateur by poking around.

On Organizing

My favorite way of poking around in politics is through mapping and cross-tabs. The party database can do both. But before we get into data analysis, we have to develop a list.

Breaking down the database into manageable chunks of cohorts is a great way to be strategic and build a club. There is a lot of talk in the 2020 cycle about the importance of Black women to the Democratic Party’s, and I have no doubt this is true.

But how do we build the list for outreach? If we query every registered Black female, we will have too much data. Not all of these women are actual voters. So let’s go back to the purpose of our organization: we want die-hards and activists who will volunteer and engage in the political process. We want them to join the club and participate in some form.

At this point, we aren’t asking anyone to support a candidate because we want people to support a dialogue of ideas for our cause, not the candidate. To that end, we want regular voters to speak with first. They appear to have the highest interest in politics.

If we search the file for African-American women, we can save this search as a list and use it to create other lists. Let’s say our search yielded 1,000 Black females registered to vote in our area. We can then search this new list for women who have voted in the last four elections. Of those women, 120 voted in each of the previous four elections. If we have the right permissions, we should be able to see activist codes such as volunteering for canvassing or phone banking. Some may attend events. Others may only want yard signs.

We now have a good start for our outreach. You can break the 120 women into smaller components to speak with each group about their specific activity or leave it alone. Being able to scale your list to your ability and time is very important.

Remember what I mentioned above. Many people don’t know their voting status is public. We don’t know how they voted, but what elections they voted in are public records. Someone will question how you came by information about them. Be clear and upfront that their voting history is public record.

But to the point, these differing levels of activism are good indicators of the likelihood a person will be interested in the club. Because there are many reasons people go beyond voting and choose activism we might want to look at irregular voters, that is voters who turn out inconsistently and see if any of them have ever participated.

We can go back to our full list and query for women who have voted in any three of the last four elections, an eight-year history. We can also break this list down the same way we did with regular voters and rank their activism.

Using your list

You can assign the list to a phone bank or cut it into turf, a neighborhood to walk, for canvassing. If you are building your club, then I would highly suggest walking house to house to talk to the women on your list. Personal outreach has a higher rate of success compared to phone calls. They may have questions for you and will feel more comfortable speaking person-to-person.

I would suggest having a pamphlet inviting them to you meeting and including contact information when you walk. Every house should get a pamphlet whether you talk to them or not.

You will need a strategy to build a connection with your audience. That may include email, social media, and a website. Collecting email addresses and social media handles is a great way to develop your voter list and your membership. Some people will not want to go to meetings but may join the club. They may only come to one meeting a year, that is fine.

Your membership will likely be a mix of virtual and active people. For people involved in politics, we all get involved for different reasons and with varying concerns. Your job is to be able to meet each person’s interest.

My take on clubs is that they serve a great community purpose. But they are only limited to what their leadership wants. Successful clubs will attract candidate attention, sponsor events, and have a presence in the broader community. It is up to leadership to determine how they want that relationship to work.

This is meant to be an introduction to the voter file with some suggestions about organizing your club. You’re welcome to contact me and ask for specific guidance. I will expand on some of these issues in later posts.

The User Experience

Folks, the political field needs to up its game. And until voting includes a virtual reality program that allows you to punch the candidates you don’t want representing you we need better solutions for voter engagement and mobilization.

Political parties and their smaller public interest group friends haven’t all transitioned into modern activist organizations. It used to be they managed coalition and machine politics. Today, they’re tech companies acting like whips for patronage and defenders of their constituents.

The core business of parties and interest groups today is data management. Their primary concern should be to build and clean data so they can communicate with the different sectors of their interests. Their infrastructure should focus on dynamic pathways of communication knowing these paths will be fluid and provided by third-party vendors. That’s the modern model for politics.

What parties have to focus on are finding those dynamic pathways that are the most efficient and that their constituents can adopt for their own.

Restaurant and entertainment venues consider everything about your evening out in the concept phase of building their business. Attention to detail and proper planning make for a better experience for the customer, and they reward these companies with higher spending.

The user experience (UX) is the central part of any business in the hospitality industry. For tech companies, it is the primary concern among the competition for apps. It is what keeps people on the platform and and coming back to their seats.

The UX also exists in politics, but not enough attention is on it as a core component of the campaign and party operations. The user experience includes everything in politics. It encompasses everything about your constituents and their possible relation with the organization.

Knowing your brand is not the same as knowing what your UX means to people.

Not every political organization today has been able to identify its user experience. They have a bag of tricks to get their constituents to give money or do calls to action. But, few political organizations put constant attention into the overall experience they have with the public.

Times Change

It used to be that the political cycle was a four year period of presidential elections with a midterm bump in activity. There would be high activity in presidential years and low turnout in off years. Fundraising has become a constant, but actual action use to not be as meaningful in the same way.

Public action is now a constant necessity because a lapse in interest becomes a lapse in the user experience. People need to stay connected in modern politics, but we also have the technology to help people stay connected. Only a lazy organization would stop engaging their constituents with calls to action and engagement.

The cycle is now two years, always. The reason is that voter rolls get purged in massive amounts before important elections as a political tactic. Purges have become a standard tool in the Republican arsenal to win elections in crucial states. Tolerating this action is the highest form of fraud for any political organization because you’re saying their money is good enough for you, but not their vote. Expulsions put every political organization on code red to protect their constituents and their issue.

Issue organizations have to have stronger ties to these constituents. They can’t just manage a donor list they can tap. And they can’t just email a list of activists who will show up and write letters. Today’s organization has to be more engaged and manage a voter list they can verify and protect. Downtime is a thing of the past. The days of constant engagement are here, and you need to have a UX plan.

It is ironic, Republicans take a profoundly undemocratic action, and the only way to fight back is actually to take an action that leads to greater democracy.

90% of Politics is Showing Up

Who showed up in 2018 and why? Interest groups should have already been looking at these questions ahead of 2020. Public relations campaigns focus on who, what, and why and build attention from there. That’s an older model that doesn’t reap the same rewards we see in UX. We are often more focused on the who and what in this circumstance than anything else.

The UX process starts with internal reflection. We are more focused on why people use our product and creating excitement out of its utility. So we start by answering why then what, and how.

A political organization’s why is always its values. Our why is the issue people act on that ends with voting, the what. The environmentalist votes to protect the earth. The environmental organization exists to push people to action to protect the planet. The most important action they can push for is a vote. Without the vote, there is nobody with a favorable ear to lobby. The how is how we vote. It doesn’t matter how hard anyone makes it to vote. Our UX will make it so that people want to vote because we are always telling them why and how.

Data Management Strategy

Each organization is going to be different in who they target, but they all have to be engaged, or they will be replaced. Political organizations and professional groups used to add value to their primary focus by offering insurance, specialized education, and other services for members. These services are a part of the UX. But they don’t go to core interest, so they are just throwaways like hat night at a baseball game.

Voters and everyone purged from 2018 are the first people to protect- tier one. Tier two are the people who showed in 2016, but not in 2018. These people are likely to show up in 2020 and need to be re-energized. Our tier three voters are our infrequent and expansion voters.

This scheme is nothing new. It’s not complicated, and anybody who has run a field program in any tight race has done something similar. Data managers should be driving this process and need to be looking at the long game laid out here.

Technology has opened up all kinds of new paths for efficiency in communications. Blending the best data management plan with strong vendors who can provide online backend communications support for social media and dynamic online advertising will become the future platform model for political organizations.

This model might sound complicated, but campaigns need to adapt as technology and costs change. The reality is that staff who can manage these processes are a low skill resource in the industry, but they are of high value. Most of them are college students, and online management doesn’t require coding skills if you use the right platform.

It’s an exciting time to be in politics if you care about why you’re there.

Adaptation to Change

I once read it took the English over 100 years to adopt the use of the fork while dining. The English saw the fork as an extension of what they called French effeminacy and argued the proper way to eat is by using one’s own hands.

And, at one time in France, women were believed to be of ill repute if they were seen out at night dining. It took a lady of high status to join friends in a very public display to change people’s minds. In this story, she is a prop for the purpose of public relations in, what I remember to be, a new fine dining restaurant seeking to succeed. This one event had a remarkable change, not only on the culture but on the economy of France. The French, long known for their love of spectacle, created a market for spectacle based on what could have been a scandal. It is difficult to criminalize what, and who, we love.

We often see change as a right. Change is analogous to choice and if we choose mashed over fried potatoes is of little consequence until we decide to have rice. But, can we get rice? The feelings are not the same when we are told we will be getting rice when we want fries. People like options, but they don’t like being force fed.

This is similar to the state St. Louis is in right now. We have nothing but change on the menu today. The idea of having to adapt to change is fed by fear and that is a bitter meal.

We are trying to welcome new-comers to our region to grow. Any region trying to compete has population growth on the menu. This includes growing our foreign born population. St. Louis is an insular place with tremendous civic pride. We support our communities so much that we are often in the top 1% in charitable giving in the whole US.

Some are also trying to effect social change. There are big fights between progressives and conservatives in the region wanting to see more equitable solutions from local government. Ferguson, a small suburban city in the region, has been a catalyst and a choke point in this effort.

A police shooting of a young, unarmed, Black man in Ferguson launched protests and conversation about what our region was doing wrong. The event came four days after the first Black county executive was ousted from office under a dubious campaign calling him corrupt. I was a member of that administration and remember the chorus singing the tune of corruption, which was nothing but dog whistles.

But before these two events there was unemployment through a prolonged downturn in the economy. The Black community was hit harder than most and inequity would be the timber which would soon ignite into fire.

And, just before the events in Ferguson would become a symbol of dis-function in the region, a group called Better Together (BT) would launch their efforts to restructure the city and county governments and limit the authority of local governments like Ferguson. By erasing the imaginary lines of city boundaries in favor of a unified regional government, they argue a common voice can lead us to a better position in the global economy.

Their early internal polling showed that the region is against the change BT want, but not necessarily the rest of the state. BT saw that, after hearing messages about the benefits and problems with status quo St. Louis, statewide voters moved to be more favorable to voting for unification compared to the voters in the region.

The poll identified the vehicle of change: a statewide vote. And now, this is the biggest fight in the region. In fact, regional consolidation includes the fight for equity and the growth of the region. But as much as a consolidated region can improve equity, mostly through spreading planning decisions like low-income housing and improving access to workforce development and jobs for all, consolidation means concentrated power.

Concentrated power is a big part of what people are against. Until yesterday, it was certainly what I had been against because I don’t trust the person who would have been running the whole show. The BT plan was to skip the regularly scheduled election and instill the current county executive into the newly created metro mayor position. Not only does the new position benefit from stronger powers to govern and make decisions the position includes a greater portion of the metro area and limits the local control of existing municipalities within that area.

Fortunately, the current county executive is being investigated by a federal grand jury for contract rigging and will not most-likely not be continuing his “service” for much longer. But the structure of the government and power of the metro mayor do not change, just the first design on who would conceptually lead the region.

Most people are against a centralized government that would largely erase the hyper-local city governments in St. Louis where people reside. This is why a statewide election is the only possible vehicle to get the outcome BT wants. Restructuring the St. Louis region is not in the interest of the people who live their today. It is in the interest of the people who will come after them. The quaint communities that makeup St. Louis are the embodiment of living nostalgia. But they are all past their peak.

The statewide vote raises serious issues of self-determination and rights. It is certainly an infringement on the concept of government for the people and by the people. Here, self-determination is in conflict with the notion that cities are creatures of the state. The state does have an interest in the future well-being of St. Louis. But does it have the right to direct a change that has been in conversations for over 100 years?

We have to acknowledge the slippery-slope and comparative analysis fallacies that go along with this discussion, but we will attend to them at another time. These are statements that if they do it to St. Louis, they can do it to X and then the comparison of X city either in the region or another state. These hypotheticals are pointless because they are too simple and ignore the complexities of regions, especially in St. Louis.

The present policy Better Together is pushing is all about control. The City of Champ is a model example. It exists in St. Louis County and was built on the idea of being a domed Olympic stadium. That never came to fruition, and the 518-acre incorporated village became a landfill. It is a corporate town with just enough residents (14 or so) to keep it from being dis-incorporated (everyone who lives their works for or is related to workers of the company).

As it stands, Champ has full self-determination as prescribed by state law. But a landfill is a messy business when it comes to governing. Consolidation would likely mean a change in tax structure for the business and possibly reconfigured regulations. Mostly it means a wholesale shift in their political power.

Proof of this comes from those who would most likely want to see this operation change. Whether or not an environmentalist lives near an environmental issue is rarely of consequence to them. Changing the structure of governance would have a real impact on the possibility of regulation change in this instance. Businesses tend to want something close to complete self-determination for themselves.

The policy implications are such that there are community benefits as well as concerns. For the few people who live in Champ, it is pretty evident that they lose a lot of their voice for a government that attends to their concerns. They may start getting more services, but it changes the fact that it is actually most consequential to them and the greater St. Louis region. That is, why live here?

In some rural communities, cities are fighting for their lives against laws regulating CAFO’s. A CAFO, or concentrated feeding operation, produces a lot of environmental waste and disruption in the form of dust, runoff and foul smelling air. They aren’t good neighbors. The legislature in Missouri has been debating legislation which would make it impossible for counties to regulate CAFO’s. This is good for these businesses but not for the greater community.

The same could be said of the Better Together proposal. Most industries we have in St. Louis would certainly benefit from having one government and code. Policies like these, pushed for the benefit of businesses, can have dramatic effects on communities.

But, just as most people like a good steak, our trash has to go somewhere. How do we meet these needs while maintaining control of our community. There is a lot of value in noticing similar constituencies between residents fighting CAFO’s and residents fighting BT.

BT claims one regional government will implement efficiencies that don’t exist today. But this is also a false argument because of the vast majority of municipalities in St. Louis County contract with the county for inspections on electrical, plumbing, building and other codes. This means those cities are mostly using the code adopted by the county already.

So if we’re all ordering off the same menu already, albeit with multiple logos, why is one menu with one logo better? What does the new menu have that we don’t already have? And what can one menu provide that 90 can’t?

Let’s go back to graft. Our county executive mentioned earlier is on display for exactly what people should be most concerned with in this deal- contracts. Contracts are big business and the reality BT is not dealing with is that contracts, just like tax credits, can be bought and sold. Since the 1950s, the St. Louis region has created dozens of private organizations to manage public services.

Transportation: Metro (once called bi-state), Great Rivers Greenway

Municipal: Metropolitan Sewer District, Zoned trash contracts, private water supply, Regional Health Commission

Economic Development: The St. Louis Economic Development Partnership (EDP) is a regional eco devo service operating an umbrella organization of about a dozen entities empowered to manage loans, grants, land reclamation, oversees regional industry sector development. It operates under a formal agreement between agencies in the city and county through the brand of the EDP, which is dissolvable.

Entertainment: St. Louis Zoo, Botanical Garden,

These entities and more operate through agreements with the city and county. For instance, St. Louis County has a sales tax for transportation. There are other taxes but this is just an example for simplicity sake. They can use that money to provide transportation in just about any capacity they want. But, through the structure of the organization of the board for Metro elected official have some control over operations.

Metro is the only real game in town for what we consider public transportation and considers that revenue stream as theirs. But cabs could also become public transportation as well as Uber and Lyft. This would certainly change the politics of the St. Louis Metropolitan Taxicab Commission. It would change the nature of service delivery and change the market in many unknown ways. With modern technology, diversification may actually lead to more efficiency in the short run, but not meet all the needs in the long run.

Consolidation may meet regional needs in the long run. But, that is only if the person in charge values equity, efficiency, productivity and the perceived value of existing communities over political ties and power. The BT failure is that they are putting faith in government over the pride of communities. How can we have faith in government while our leaders are doing a perp walk?

For the past 60 years, St. Louis created private and quasi-public organizations run by nonprofits to provide infrastructure and services to the region. This increased complexity actually limits local communities from tapping into their tax base. It also hides things of value form the public, like contracts.

Major change like the one proposed should come from within an institution and branch out. Forced change not only faces questions of legitimacy, but also rips people’s sense of buy-in away. The English, in one way, rebuked change that seems like a beneficial idea all because of where it was coming from. The French embraced change because of who it came from and why.

If the state decides we are required to change people will eventually adapt to the change by attrition. That is those opposed to the change will do their best to vote with their feet or die trying. But I don’t see the change being of any consequence to the run of the mill resident. I see the change as an attempt to manage procurement and bigger contracts to fewer organizations. Whoever has control over the contract process will have control over the well-being of the region. Let’s hope they stay out of jail.

Triangulating Outcomes

Source: St. Louis City Planning
Sources: City of St. Louis Board of Elections

Column-
1: Wards
2: Republican Governor’s Vote- 2016
3: Lewis Reed’s vote in the 2013 Mayor’s race
4: Francis Slay’s vote in the 2013 Mayor’s Race
5: Mayor’s Race vote total between Reed and Slay
6: Slay’s vote minus Reed’s vote in the Mayor’s Race
7: Reed’s Vote in the BOA President race
8: Nasheed’s Vote in the BOA President race
9: Green’s Vote in the BOA President race
10: Total Vote in the BOA President race
11: Mayor’s Race Total Vote Minus BOA President Total Vote

The 2019 President of the Board of Alderman race is exactly what the Democratic Party needed at this time in St. Louis. A three-way race between a black male and white and black females shows exactly where the splits are in St. Louis. And there’s a good chance we can extrapolate this information to show the same veins in the county.

The table above tells a hell of a tale on that race. The first column of Republican voters for governor. You may be asking why I would include something like that in a primary race for the Democratic nomination. The answer is to show there are republicans that turn out. But when it comes to the mayor and BOA president race these Republicans vote Democrat. Sure, not all of them. But a lot do. And even if it’s only half, that’s enough to win in yesterday’s race.

Reed demonstrates this by winning four wards where there is significant Republican voting.

I include the results from the mayor’s race to show the old guard outcomes. It appears that Reed has taken control of most of that Republican vote to maintain control of the BOA. However, his performance is not as good against progressive females in Democratic precincts. In other words, the conservative Slay coalition has switch over to Reed and the Reed coalition largely split between Nasheed and Green on racial lines, based on racial mixes of wards. The city of St. Louis machine is in flux.

Reed maintained a relatively stable vote per ward garnering no less than 200 votes in all but 2 wards, while winning only 5. Nasheed won 13 and Green took 10. Most wards way under performed compared to the mayor’s race, which is to be expected when issues like less money come into play. One report pegged the total spending at $1m. But Green pushed 3 wards to increase their vote in the BOA race and Nasheed and Reed each pushed one.

Each candidate’s outcome is interesting by what it tells us of St. Louis at this time. In the context that all incumbent aldermen won their races we would expect Reed to coast to victory. And he may have coasted. Green looked to solidify her progressive base, but lost African American support to Nasheed, who ultimately saw neither she or Green could win a three-way race and publicly asked for a sit down with Green.

The problem there is that Nasheed and Green were fighting for the hearts of activists and Reed fought for the heart of the city- a centrist leader versus two liberals.

The mechanics of this race are peculiar. Looking at the first five wards, which are largely Black wards, Reed lost to Nasheed almost 2:1. He was closing in on 3:1 against Slay in the mayor’s race. That’s a big flip in the other direction for him. Notwithstanding the decline in turnout, Reed should be concerned with what comes next for him.

But, if it is the case that the progressives can now run the town it appears that Nasheed and Green should sit down to decide what that means and how they should run it

For the progressives, they now have a treasure trove of data to resolve. When the precinct data comes out they will be able to triangulate what comes next with a clear vision.

But, they have to ask themselves if this vision is shared or if it is mutually exclusive.


Florida 2020

This document dives in on the state of Florida pointing out relevant data, voter trends and relevant recent events.

Other Sources Not Included:

Florida isn’t just a toss-up at this point. Florida is a conundrum. Republicans eked out their wins in the mid-term. The 2018 US Senate race cost $181 million. As I’ve mentioned before, there won’t be a Senate or governor’s race in 2020. That means there won’t be a notable big-ticket candidate going around daily building up momentum for either side.

Republicans control the governor’s office, which will help a lot on the ground. They also have a one-seat edge in the congressional seats. All but two seats are relatively safe. Those both flipped to the Democrats in ’18 and only one of them came within two-percentage points.

Trump saw big gains in 2016 and his coattails appear to be long enough to help two statewide officials get elected, barely. Democrats hold a lead in voter registration over Republicans. But, voters who do not have a party identification is increasing, as are those who identify with the two major parties.

2020 will likely come down to those voters who don’t identify with either party, but are more upset with a certain one. The state legislature should focus on tending to the needs of the people while finding a way to blame the feds for the local problems. This message is likely to work for both parties.

The Road to 2020

A tree with a branch sticking out with many little branches on the end of a limb and clouds above.

Download this chart of the 2012 and 2016 presidential election and then make your own prediction for 2020.

This table shows the 2012 and 2016 presidential election results by state and including the District of Columbia. I then compare the turnout between the two elections by total vote, and the Democratic and Republican Party turnout. Finally, I analyze the Obama vote with the Trump vote.

In this hypothetical scenario a Trump candidate would beat the Obama candidate with 274 electoral college votes.

This is an important comparison because it raises the question of whether there is a path to victory for a Democratic challenger to the sitting president. The states to watch are the swing states Obama and Trump won. The mid-terms saw Wisconsin and Michigan elect Democrats statewide after going to Trump in 2016. The backlash to right-to-work laws is likely to favor Democrats in 2020 in these states.

I would not expect this backlash to be found in Missouri where a referendum was soundly defeated at the ballot box.

Republicans barely won Florida in the midterm elections. This could make for another exciting cycle when Trump has the state to himself to defend his electoral victory. The hypothetical matchup shows a decisive win for Trump against Obama. However, federal reaction to hurricane damage and an influx of Puerto Ricans coming to the mainland due to the almost nonexistent federal response to the island’s damage is impacting the state politics. Although one might expect the president to coast to victory based on past performance we will likely see him very vulnerable and struggling.

The chart shows Republicans expanded their vote by 2 million between 2012 and 2016, while Clinton had a net loss of nearly 100,000. Digging in on these numbers we see that the California vote masks the real losses in other states due to the pick-up of over 868,000 votes in this time. The Obama coalition actually out-performed Trump by 1.4 million votes nationally and we look to this as a guide for the path to victory for both sides in 2020.

Looking at each of the states that Obama won but Clinton lost tells us where the 2016 election was decided. Clinton lost a significant number of votes in all but one of these states giving Trump the win. A review of the 2018 election and a look ahead at the 2020 ballot will give us a glimpse of the troubles both parties face ahead

The 2020 Scenario

The states to watch continues to be Ohio and Pennsylvania. Democrats won the Senate seat and the governor’s office in Pennsylvania and split these offices in Ohio in 2018. Pennsylvania and Ohio ballots look like Florida’s with Trump leading an empty ticket.
Republicans have 22 Senate seats to defend, with a special election in Arizona, versus the 12 for Democrats in 2020. The problem Republicans face is that they are on defense in what are largely considered to be safe states for them. Democrats may trade a loss in Louisiana where Doug Jones has to defend his seat for a win in Maine where Republican Susan Collins will be hard pressed to defend her vote for Kavanaugh.
The problem Trump faces is that he would be better served with full tickets in battleground states. Instead, he has weakened congressional support after losing the House in the mid-terms.

Trump is in a better position to defend when he can use his coattails in support of another candidate to energize a whole state. Further investigation will need to be done to see his performance in states where no one else appeared at the top of the ballot with him.

Meanwhile, Democrats are throwing the kitchen sink at the election with candidates appealing to every constituency in their coalition. Their base has proven their ability to mobilize and Trump will continue to energize them. The key to success will truly be who can unite the party and turn that energy out on election day.

The Democrats would benefit from a lengthy debate rather than a decisive early win for one of their favored leaders. At the same time, Trump may find it difficult to motivate his base and retain the independents he pulled his way who suffered from Clinton fatigue.

Trump is likely to lose Wisconsin and Michigan in 2020. He may also lose Iowa if Democrats go with a centrist, although I think Biden has the best shot of winning all three he would need a credible progressive to complete his coalition and maintain the energy in the party. The lack of a full party voice in Florida, Ohio, and Pennsylvania may be the end for Trump.

The 2020 election is about the future of the country in a way it never has been before. Republicans are digging in their heals for smaller government that protects socially conservative ideals of pro-life and pro-gun lobbies. Democrats are eyeing a turn in the economy with the Green New Deal, healthcare for all, and ensuring equal protections for all people.

At this point, Democrats have found a deep bench of qualified and inspirational candidates representing up and coming challengers to what had once been safe spaces for Republicans. The possible near future loss of Georgia and Texas would upend the Republican path to victory for a generation. Although neither state has shown cracks in any recent presidential election they have become surprised contests among new talent from the Democrats.

Incumbency is usually seen as a plus for a candidate. However, if the stories are true and people feel he has turned his back on them, citing issues like tax reform, natural disaster relief, and an unpopular government shut down, then we may see Trump finding a new group to blame for the woes of America. Namely the American voter.


3 Speeches

Yesterday, the longest government shutdown in US history ended. A compromise to re-open remaining offices and provide back pay for some 800,000 federal employees has been put forth with additional funding for three weeks. President Trump announced from the White House Rose Garden the plan in a speech.

One of my favorite things to do is writing for candidates and elected officials. A good speechwriter gets in the head of the orator. I like to consider the natural pauses and rhetorical style people go through. One of my favorite people I had the opportunity to write for was a local pastor who was going to deliver a recorded message to voters.

The man has a distinct style of elocution including rhythmic rhetoric with forceful tone. Obviously, my responsibility was to match his style with substance ending in a call to action for a positive vote. He was expecting a call from me to go over the material and record the message. We hopped on a call and I sent him the material and as he read through it the first time he stopped to say how much he liked what I had written. It is among the most enjoyed compliments I have had in my career.

Writing a speech for another individual can be a difficult process. But, when you do it right the orator is comfortable with the material and the speech comes off strong. In the example above I managed to write something that connected with the person giving the speech.

Trump has an interesting rhetorical style. It has been analyzed and written about and even dissected. I am often confused as to whether Trump goes off talking points or is given a speech that he delivers with random ad-libbing. He does have a speechwriter.

When Trump spoke in the Rose Garden about the end of the 36-day closure, he could have gone in several different directions. He could have spent the entire time attacking Democrats for a myriad of reasons, whether real or imaginary doesn’t really matter. Trumps rhetorical style is effective because it resonates with his audience. And they believe him.

You can see both his delivery and the transcript of his Rose Garden speech here. If you want to dig in on Trump’s public statements and tweets I recommend digging through the factba.se archives. I’ll admit I don’t always understand their methodology for what is positive and what is considered negative, but it seems to work for what they’re selling.

Have you seen the recent Gillette advertisement about toxic masculinity? It’s been widely panned by conservative pundits as a male-bashing pile-on and held as an example of the pitfalls of “woke” commercials within the industry. In reality, it may be the perfect commercial.

Although the material is widely thought to be targeted towards men because they are the focus in the ad, do you to believe it was really targeted towards toxic men to rethink their choices. It is more likely that women are the primary target of this ad. Women choosing to support the message and buy this product and those men who believe in the socially progressive ideas are the likely targets. In short, the message may not have been intended for you.

I can’t even tell you if it ever aired outside of social media. If it was largely limited to social media then they intentionally, and smartly, left out key demographics. It did create a flashpoint of debate in free media with a feeding frenzy of shares and comments helping to spread their message.

If you get hot and bothered by a message it is probably not intended for you. If there’s any genius in the Trump organization it is in that statement. He and his team have the ability to both activate his base and diffuse his antagonists. In that I do mean he can diffuse his antagonists and do not mean to defuse.

Let’s face it, Trump gives his enemies so much fodder that they all focus on different things. There is so much ammunition that every different public has an opportunity to respond. It may also be that his detractors focus more on having a differently qualified statement as to market themselves separately.

That can be a powerful weapon. Spreading out your enemies across different platforms to where it’s difficult to unify when the time comes can be a nasty form of torture.

So the speech Trump gave managed to do a few things. First, it seems to have given his base a wake-up call that they may not get the wall they want. This may become the call-to-action Trump needs to keep them engaged into the 2020 election.

Second, it gives some people a reason to say that Trump is showing he has a heart. Deep down, people don’t want to believe their president is a crook, a liar and a puppet of a foreign government. If you’re not a fan of Trump’s, then you are likely able to point to how he is all three.

Third, Democrats were lulled into a false sense of security and with a win.

If you are a fan, then you know precisely how Trump is being set up. If you are not sure about Trump, then the drama of a government shutdown affects you much more directly then the arrest of anyone associated with the dirty politics of an election. After all, weren’t both candidates for president crooks in 2016? Aren’t men toxic?

So, what if Trump gave a different speech focused on the human situation of the 800,000 employees who weren’t getting paid through the shutdown? This speech would not have been given under any condition but Trump could have moved to the center by doing so. To answer this we have to reconcile the fact that Trump’s administration is not so much Conservative but Libertarian.

The Libertarian ideology calls for free markets and no government regulation. They don’t believe in public education and believe in a minimal public service from the police. Fundamentally, people must care for themselves and can do so by their own word. Ironically, if you follow Trump’s business dealings, you might become terrified of this proposition.

For Trump to focus on the plight of the government worker would be to abandon a part of who he and his base are. Conservatives, for the most part, are just along for the ride in a Libertarian administration.

Missouri’s story illustrates this very well. In 2000, 2,361,586 people voted in the US Senate race that year. Then 9/11 happened, and in 2004, 2,731,364 people voted for president. These are the races that most people cast ballots for in those years. Nearly 300,000 people started voting in 2004 who did not previously vote. These people are Libertarian. This explains why Missouri can vote for marijuana referendums and a senator who pledges to do what Trump wants.

These people became the foot soldiers of the Tea Party and now are the power center of the Freedom Caucus and controlling interest of the Republican Party.

For Missouri, this is a significant change in the political ecosystem. It’s as if an entire underground ideology woke up seeking retribution for government failing to protect them. They are thousands of miles away from ground zero and yet awoke as if it was their backyard on fire. And this happened all over the nation.

Trump’s tweet that he doesn’t want a lot of those 800,000 employees back dovetails perfectly with the ultimate goal of his base: having no one to regulate them.

So if we hoped for Trump to hold the center ground by being less callous to federal employees that boat has sailed. He didn’t and won’t. Media portrayals of the administration being aloof completely missed the mark. It is completely reasonable to libertarians to turn to the market to finance needs rather than a social safety net.

The wall remains a goal of the administration. It is both a symbol of what is necessary and what is wrong. The absence of the wall is necessary for Trump to be successful in 2020. It doesn’t matter that space where there is an absence of the wall is where there are the fewest arrests.

The next speech Trump is likely to give will allow him to regroup. It will be a call to action followed by a flurry of events rousing his base. The next speech will actually lay out his agenda and berate the Democrats to their face. For Trump’s base, this will keep them unified and focused. Trump will also use it to test their will for a more extended shutdown.

Trump has demonstrated he can do without a status quo government. We are still to believe he can’t do without a physical wall, despite the offer of a more high-tech infrastructure by Democrats.

We move past the Super Bowl this weekend. It is an event seen by some as the reason Trump folded as flights were canceled going into La Guardia Aiport. The effect in Atlanta would be terrible for the influx of expected money for such a high profile event. One thing Libertarians can’t abide is a market failure, especially if it is caused by government failure. In this case, the safety infrastructure showed cracks as people called in or just didn’t show up for work.

The privatization of airports is likely going to be a part of the State-of-the-Union. St. Louis is debating this issue right now. The people pushing airport privatization in St. Louis happen to be Libertarian.

It’s the perfect narrative for change. The government demonstrated it is inept. If you followed the NPR coverage of prison guards and how they coped with the shutdown you often heard about how well they were paid compared to the rest of the community they served. Do you think that might sow some seeds of jealousy?

Put yourself in the mind of the person in that rural town. You are hearing about how better-off a government worker is compared to you. You don’t like government. What is your response? Probably get another job, do what’s necessary and stop whining because your life, in general, just hit a snag.

How attractive would privatization look if it ensures prison guards show up and get paid? Add airports to the debate and sweeten the deal with improvements for the safety infrastructure? You can expect all ports to be looked at for privatization at some point.

The next big travel day is Mardi Gras on March 5th. That is just after the planned three-week cease-fire. After Mardi Gras is another significant travel day with Easter. Both end a list of the worst travel days in the US. They also feature lots of money exchanging hands for Louisiana and Christians, although they are not exactly the same demographic targets here.

You can bet that Trump wanted people to give a taste of government not working. The moment they started canceling flights in New York was our “Oh, no” moment. But was it the intended message? It was a palpable moment sending messages to us all. Some of us saw it as a sign of a callous government once again not working. Some of us saw it as bi-product of politics. Others blamed Trump. But those people weren’t Trump supporters, to begin with.

So now we have a new crisis. It’s not the border. It is us. Our crisis is one of government. That is something most voters just saw. It is in part the fact that politicians can high-jack the system preventing people from working. The only possible solution could then be to privatize the system. If the government can’t protect the people it is meant to serve and simultaneously keep it running then the answer must be to privatize.

Progressive Democrats will have to struggle with their answer to this question. Their position that government works best when we work together just failed in the face of a national audience. Good government requires a people willing to negotiate in good faith. We either lack faith or our faith can be manipulated quite easily. We will know after the third speech.

So progressives, when the next speech is given in your face there won’t be a drum pounding. It will be a fist. You can stand there with a smirk on your face, or you can take action. If you understand the events as I have unfolded them, then I suspect you are not smiling at this time. That’s a lot to consider. America will be waiting for your rebuttal.